B2B SaaSMarket researchData visualizationDesign systems
Methodify: survey launches that explain their own errors
Methodify helps companies get consumer insights in as little as 24 hours. I redesigned the project setup page that stood between teams and launch, rebuilt the results charts to be accessible and trustworthy, and baked it all into the Sweet Potato design system.
RoleLead UI & UX Designer
Timeline4 weeks (setup page)
Worked withVP of Product, solutions architect, devs
Also shippedSweet Potato design system
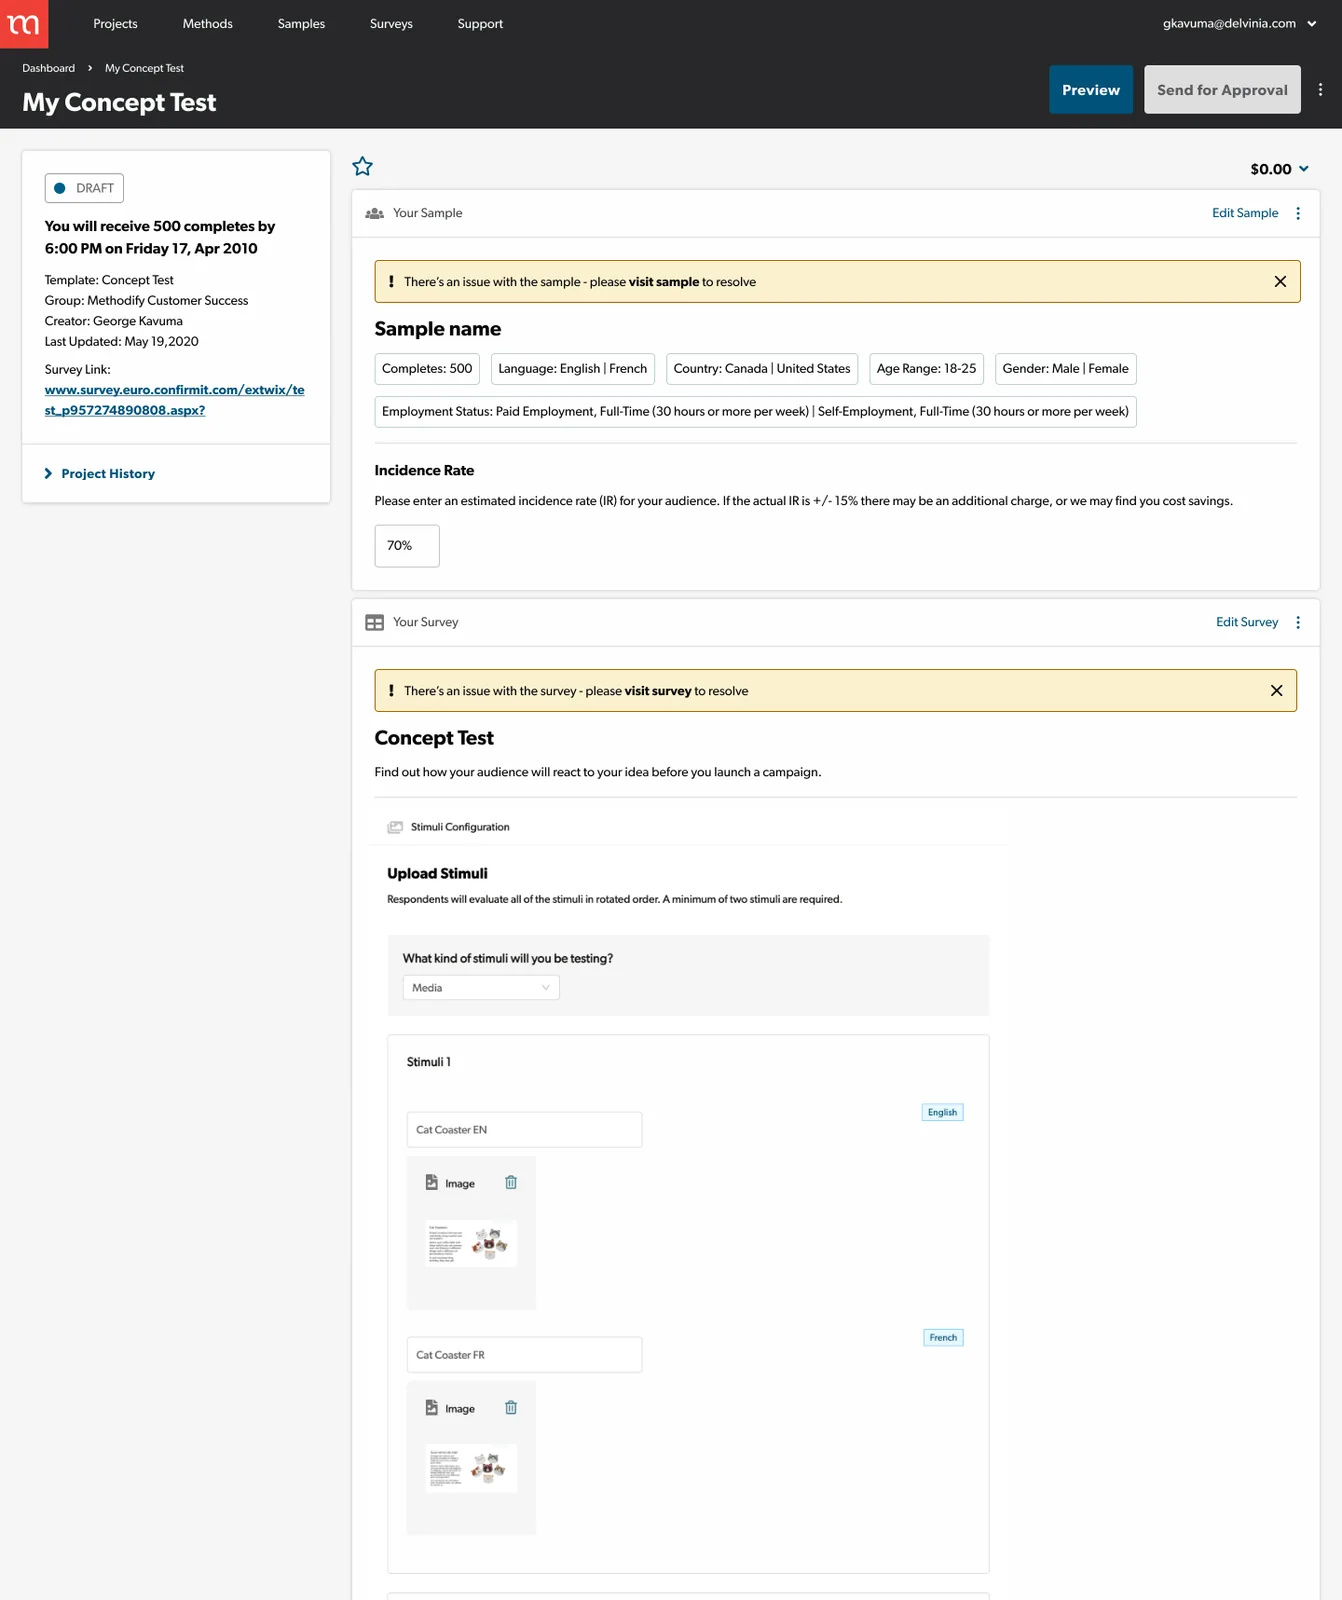
Before
After
mmethodifyBalance $0.00U
PreviewOptionsSend for approval
SampleEdit
Canada national representation (English and French)
100 completesEnglish · FrançaisAge 18–34 · 35–54 · 55–99Male · FemaleWest · East · Ontario · QuebecIncome: low · medium · high
70%Incidence rate. Low IR may need custom quoting, so your sales rep will reach out.
Survey · Incidence check, Small Business OwnerEditStimuli Stimuli 1 · FR is missing
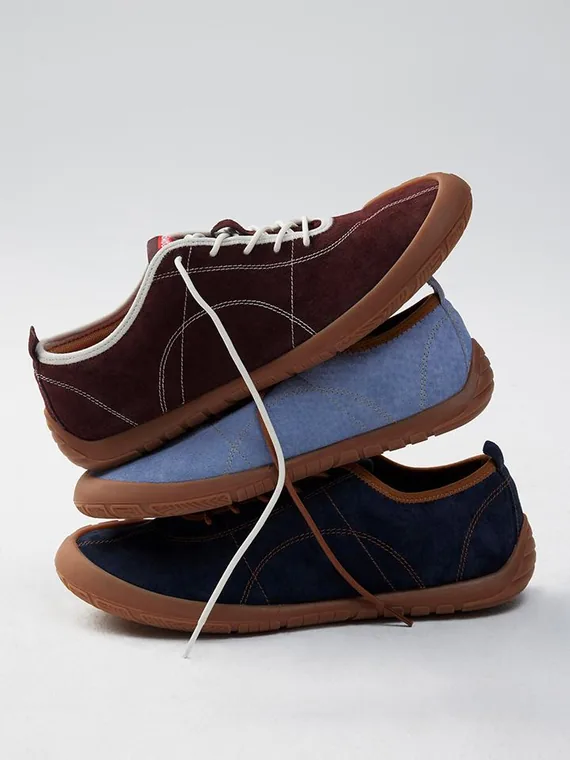
Stimuli 1 · EN
STRIDE · SUEDESoft steps, every day.Shop the colours
+Stimuli 1 · FR is missingAdd the French version: image, video or audio, up to 20 MB
<24hFrom project setup to consumer insights, with launch blockers that explain themselves
WCAGResults charts rebuilt to meet 1.4.1 Use of Color, with readable labels and AAA rollovers
1 systemSweet Potato: components, colour scales and accessibility rules the whole team now uses
The problem
The project setup page is the final step before a research project can launch, and it had become the biggest point of friction. Users configuring long, detailed surveys were hit with multiple error states before they'd even started, with no clear sense of what to fix, the project's status, who last worked on it, or what it would cost.
Once projects launched, the results weren't much easier. The charts were outdated, hard to read and not accessible, and cramped labels and colour-only meaning made the data feel less trustworthy than it was.
Research
I worked closely with the VP of Product, developers and a solutions architect. I mapped how people actually moved through setup versus how it was intended to work, reviewed the flows with stakeholders, and validated designs with user-tested prototypes before development.
Internal user interviewsCompetitive analysisEnd-to-end user flowsStakeholder reviewsUser-tested prototypesWCAG 2.1 audit
Key decisions
01
Show what's blocking launch, not everything at once
Instead of a wall of errors up front, a launch checklist shows what's done and pinpoints the one thing left, right down to the missing language version. Status, history and cost sit beside it, so teams sharing a project know where it stands.
mmethodifyBalance $0.00U
PreviewOptionsSend for approval
SampleEdit
Canada national representation (English and French)
100 completesEnglish · FrançaisAge 18–34 · 35–54 · 55–99Male · FemaleWest · East · Ontario · QuebecIncome: low · medium · high
70%Incidence rate. Low IR may need custom quoting, so your sales rep will reach out.
Survey · Incidence check, Small Business OwnerEditStimuli Stimuli 1 · FR is missing
Stimuli 1 · EN
STRIDE · SUEDESoft steps, every day.Shop the colours
+Stimuli 1 · FR is missingAdd the French version: image, video or audio, up to 20 MB
02
Charts people can read and trust
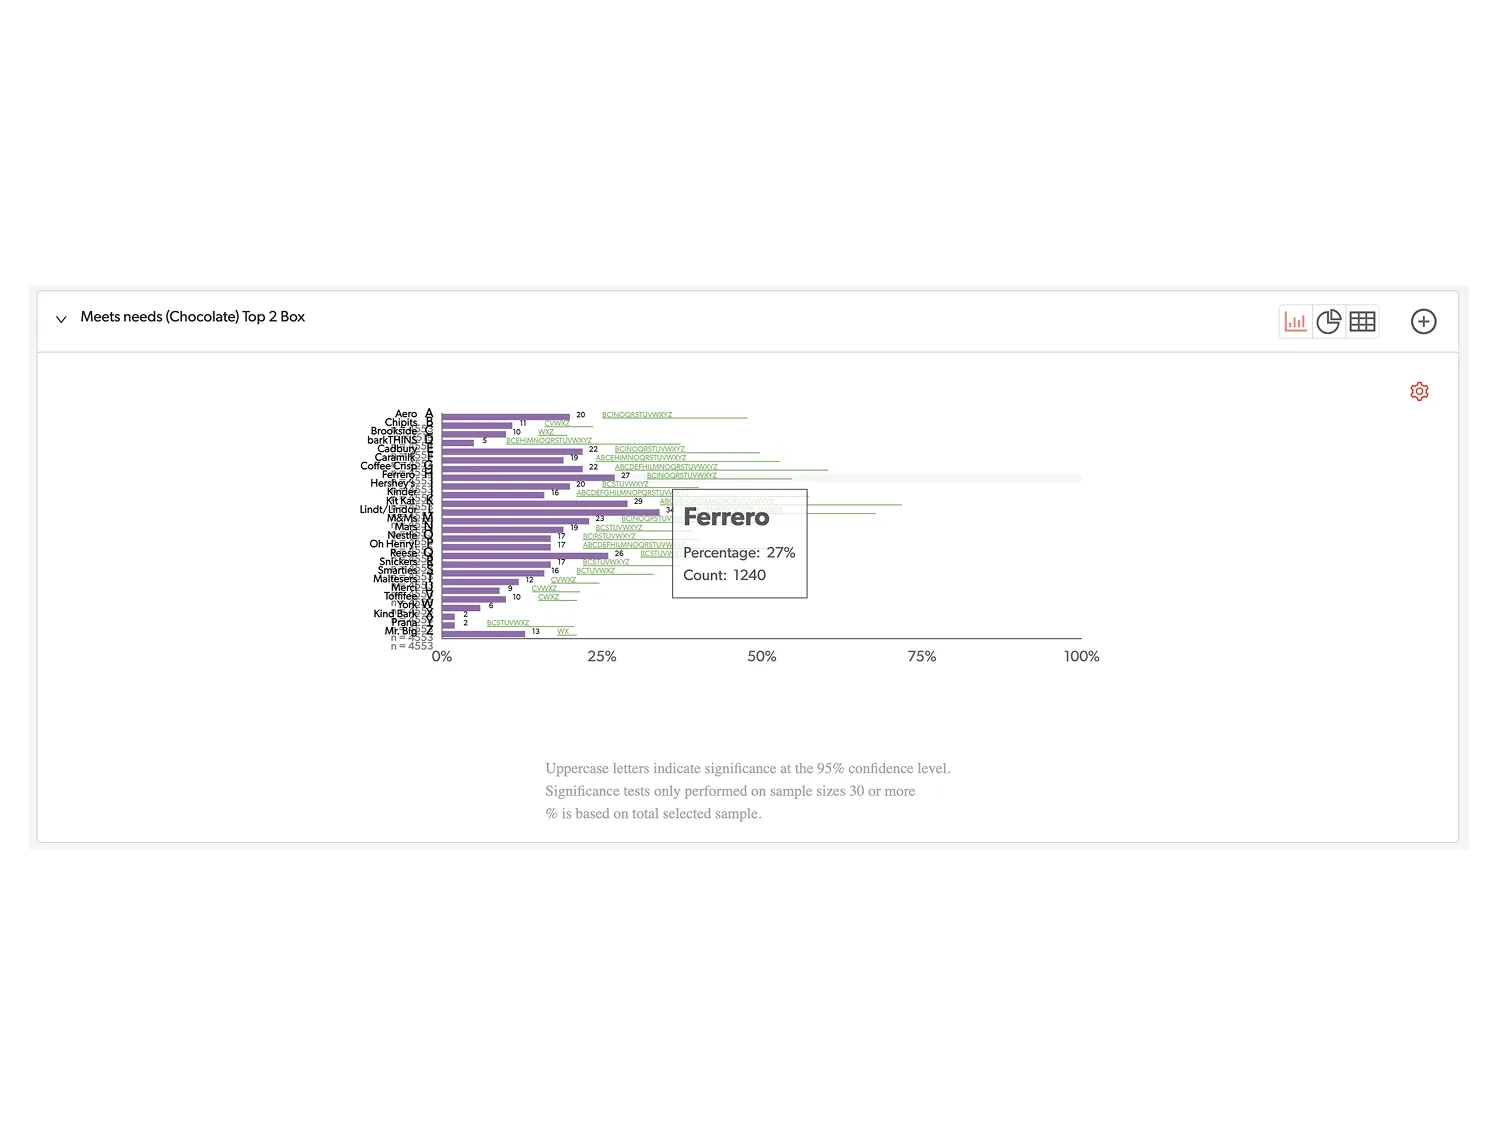
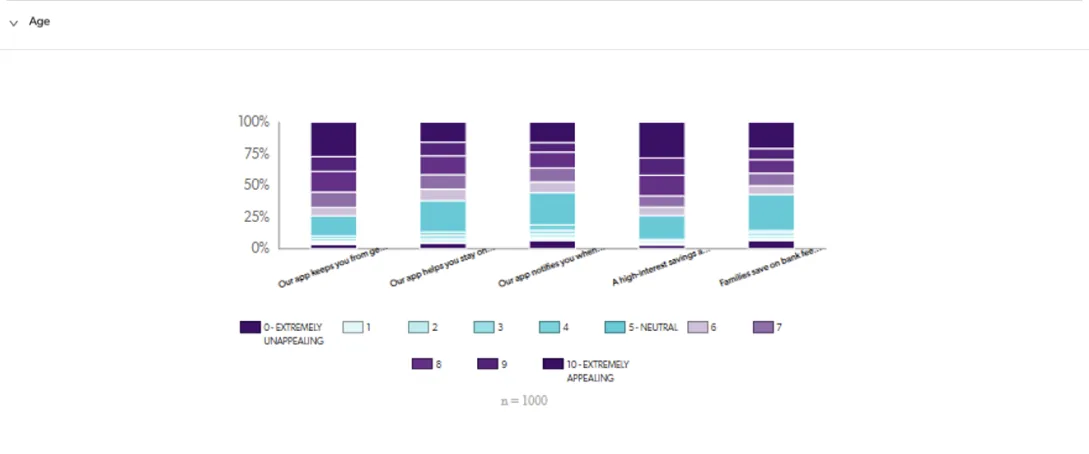
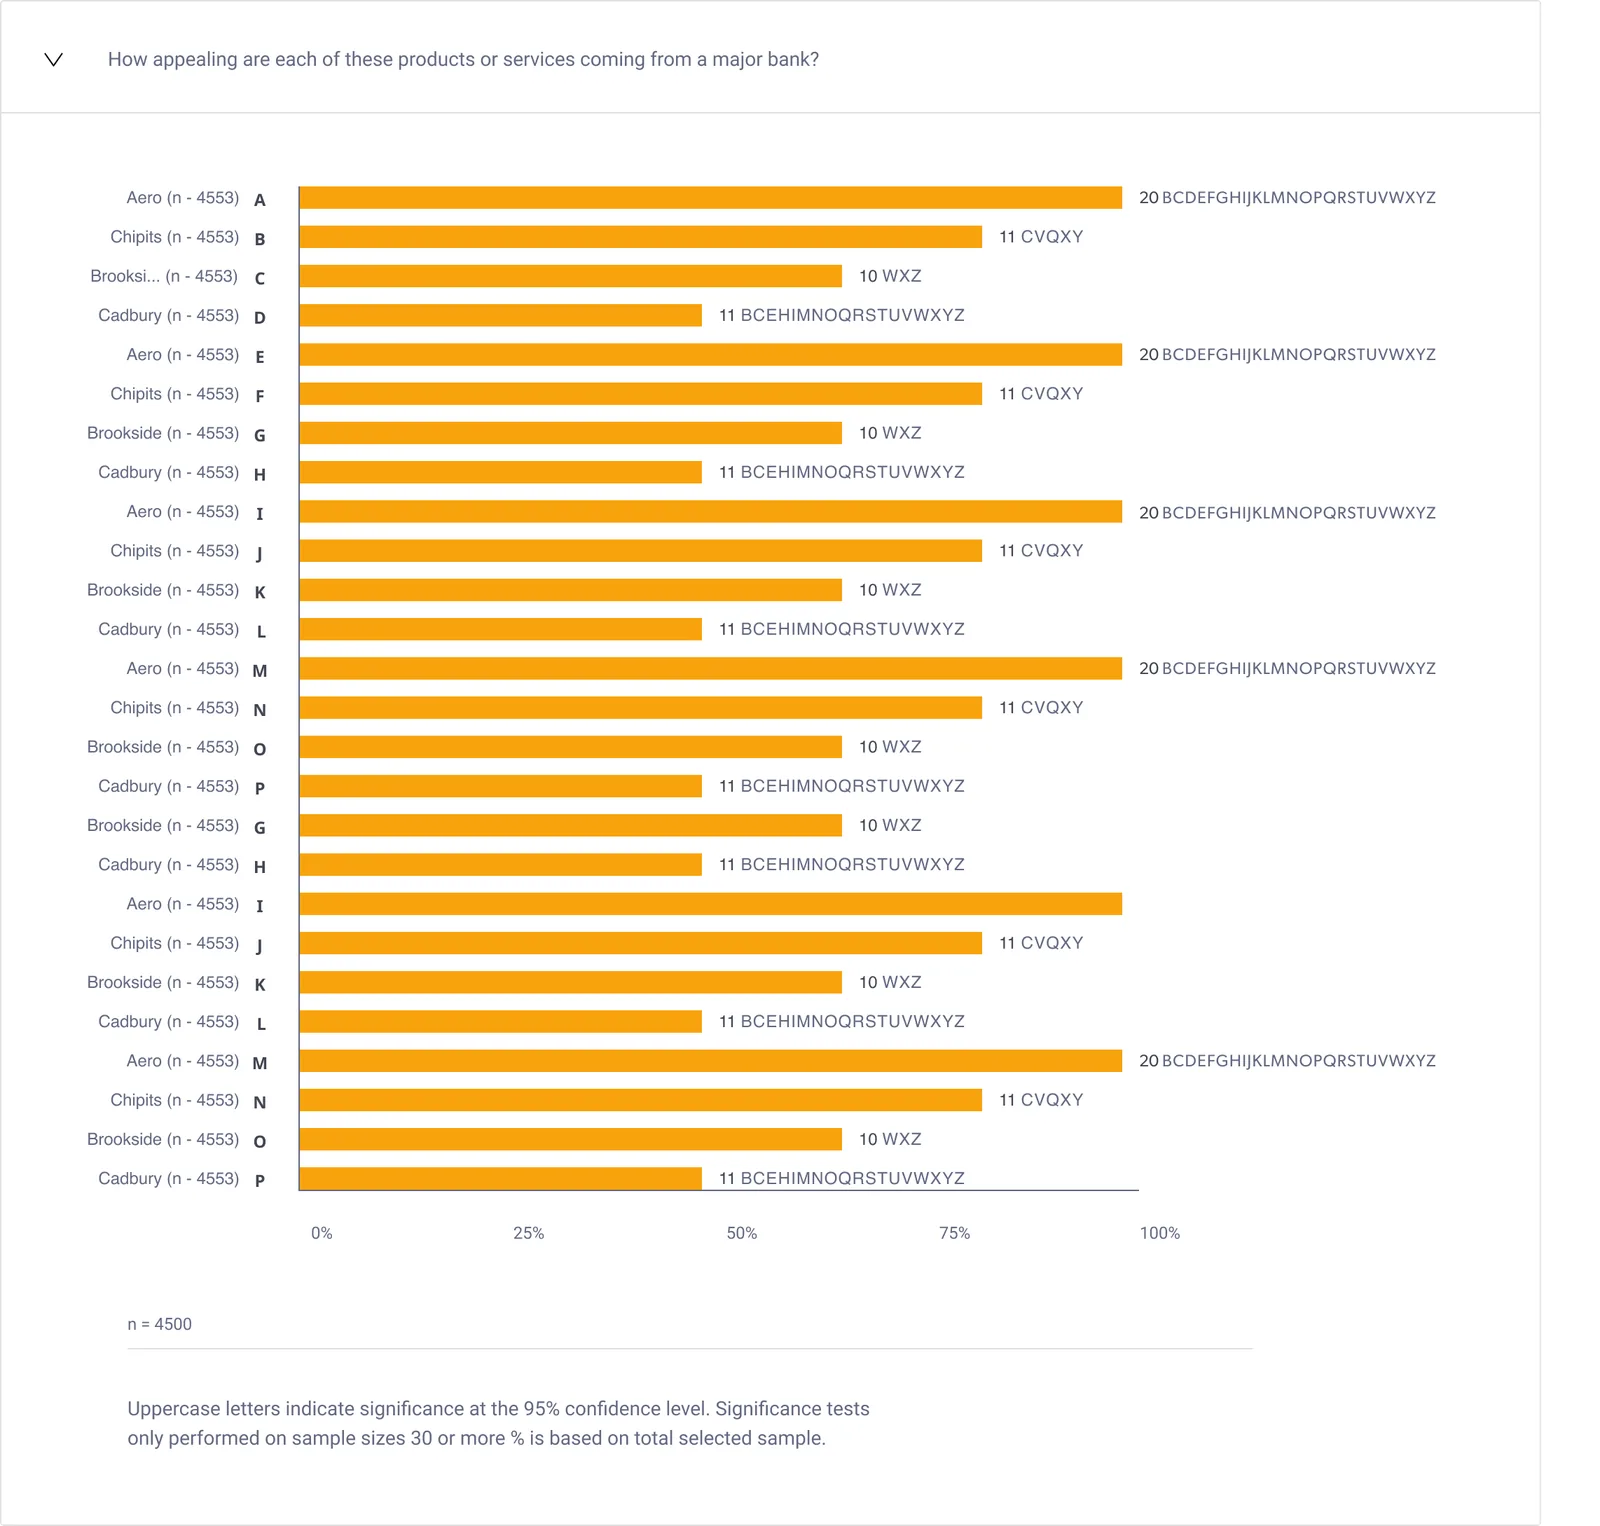
The old charts relied on colour alone, crammed labels and significance letters into tiny type, and looked dated next to the rest of the product. I rebuilt them with one clear bar per answer, labels with room to breathe, significance letters set beside each value, and a plain-language footnote, so results feel as credible as the research behind them.
BeforeZoomed in, actual size
Meets needs (chocolate), top 2 box
Appeal of bank app features, by age
Colour is the only key
11 look-alike shades
Overlapping, truncated labels
Tooltip hides the data
AfterSame data, top rows shown
How appealing is each product coming from a major bank?
Cadbury (D)Percentage: 11%Count: 501 of 4,553Significantly higher than B, C, E, H and more
One clear colour
Full, readable labels
Values beside every bar
Significance you can read
03
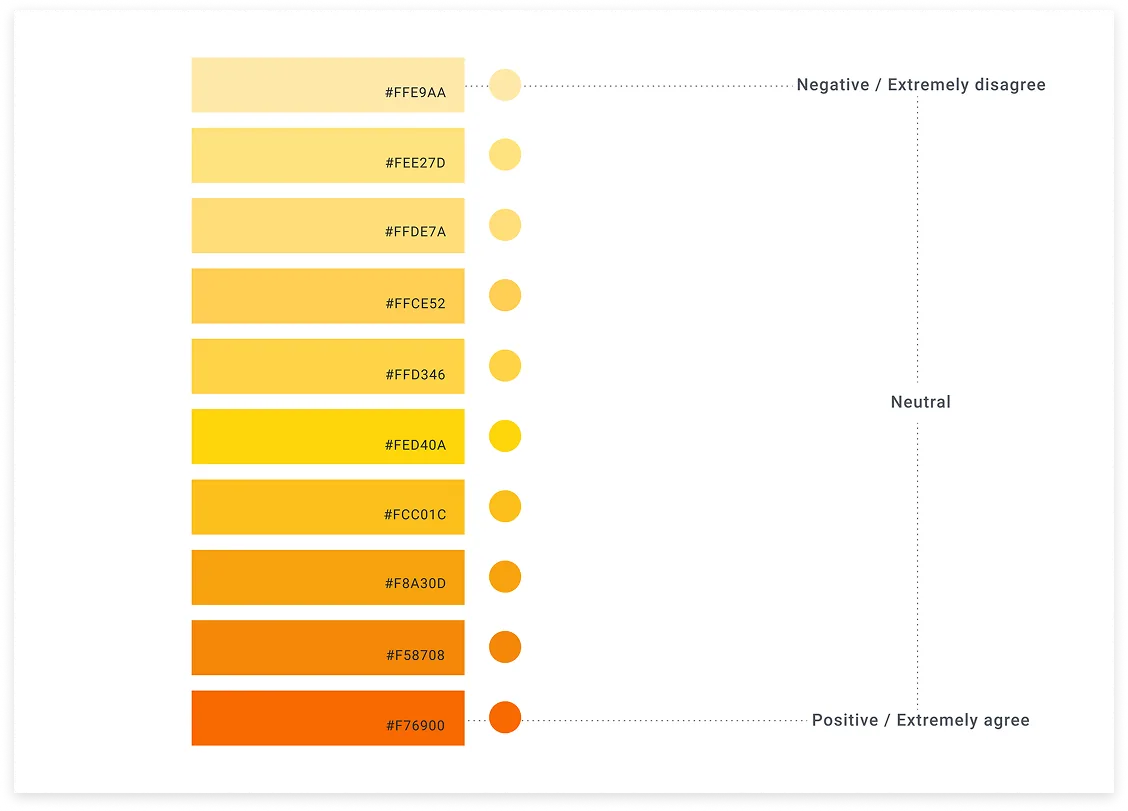
A colour scale with meaning
I replaced the mix of purples and teals with a single warm ramp in ten steps, from pale yellow for "extremely disagree" to deep orange for "extremely agree". Light to dark now maps to negative to positive, so the order reads at a glance, and every step is documented with its hex value.
04
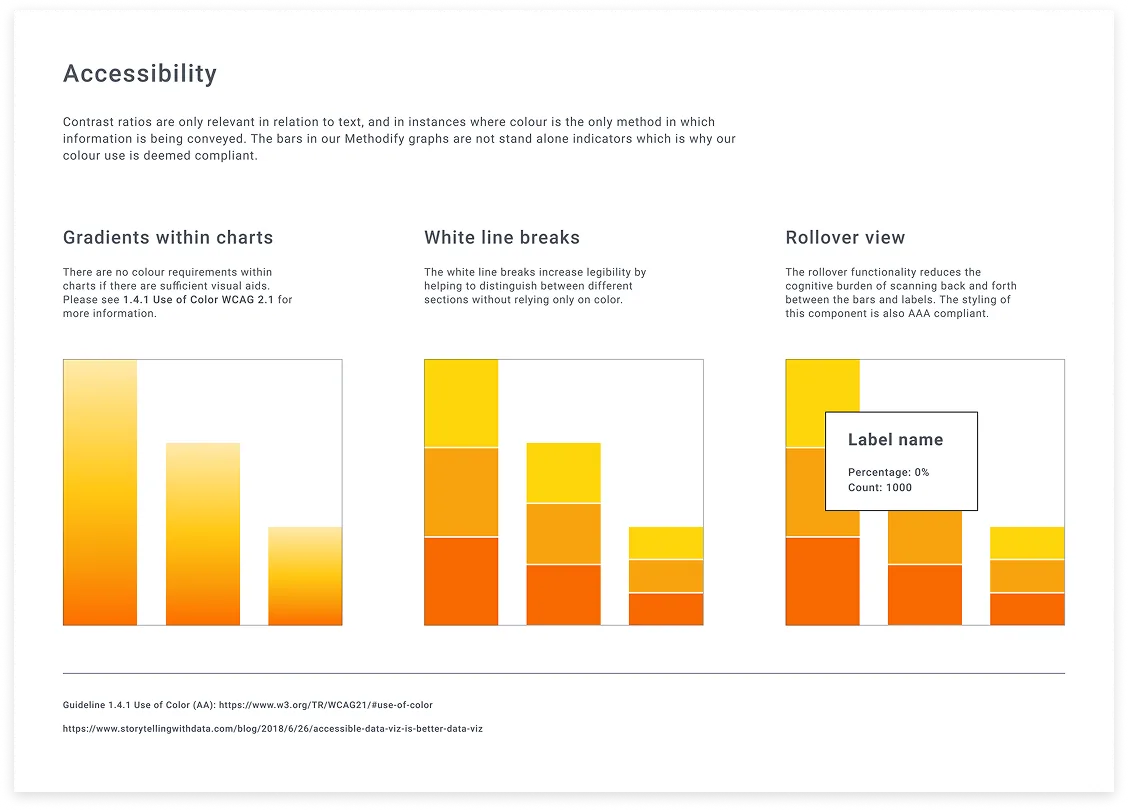
Accessible by default, in Sweet Potato
I baked the chart rules into Sweet Potato, the design system I built for Methodify: gradients only alongside other visual aids, white line breaks between segments so colour is never the only cue, and an AAA-compliant rollover that ends the back-and-forth between bars and labels.
Every guideline links straight to the relevant WCAG section, like 1.4.1 Use of Color, so anyone can check the reasoning. Then I taught the team WCAG and how to use the system, so accessibility kept shipping after the redesign did.
Outcome
A setup flow that lets teams launch surveys and gather consumer insights in under 24 hours, with launch blockers that explain themselves. Results charts that are accessible, easier to read and easier to trust. And a design system, Sweet Potato, that keeps it consistent, with a team that knows how to use it.
"Amanda's unwavering work ethic was consistently impressive, meeting project deadlines with high-quality results under tight time constraints. Her collaborative mindset and expertise played a pivotal role in upskilling team members and overall proficiency."
FSFrank SchiraldiVP, Platform Architect at Sago
What I learned
A wall of errors tells people something is wrong, not what to do. Showing only what blocks launch, and exactly where to fix it, made the setup page feel calm instead of punishing. For the charts, I put the accessibility rules into Sweet Potato, each one linked to the WCAG section behind it, so anyone could check the reasoning and accessibility kept shipping after the redesign. Next I’d track how many projects launch on the first try.
Hiring a senior UX/UI designer?
I'm open to full-time and contract roles, working remotely with teams in Europe and North America.